
Empowering a more effective, proactive government with data
In today’s increasingly network-enabled, digitally-transformed government, one of the greatest resources that the government has at its disposal is data. As David Egts, the Chief Technologist for North America Public Sector at Red Hat recently explained in an interview,
“It’s clear that data has the power to revolutionize the government. But where does that data come from? Does it all have to be generated by the agencies, themselves, or can it come from commercial partners? And how can third-party data be leveraged to make the government better and more effective?
To find out, we recently sat down with Michael Bergen, the VP of public sector at SafeGraph – a leader in the point of interest and data marketplace. During our discussion, we asked Michael how precise, up-to-date precision data could help our government improve its operations.
Here is what Michael told us:
The Last Mile (TLM): Can you tell our readers a bit about SafeGraph? What does the company do?
 Michael Bergen: SafeGraph is in the business of, “Where.” We answer the question of where things are.
We’re a data-as-a-service company. We provide the most accurate locational information and ground-truth of where things are on the planet. We also find the best partners to work with to help visualize that data.
That’s effectively what SafeGraph is. It’s a company obsessed with the veracity of precision data, and helping commercial companies and government organizations understand where things are and why that matters.
TLM: How does SafeGraph generate its data? Where does the data that the company offers its users come from?
Michael Bergen: We generate our data in a number of different ways. For our points of interest data and geometry, we use a combination of machine learning and web crawling to catalog all place locations, as well as any relevant metadata about them. This could be things like the openings and closings of stores, or whether or not that store is actually located within a larger structure, like a mall. We can use this to learn where people do business. Where they spend their time and money.
We’re aggregating data on top of those places people care about to get a good idea of where people spend their time, if there are spikes or drops in activity due to outside influences, and other trends.

TLM: How are SafeGraph’s solutions used by the government? Are there different use cases for the different sectors and levels of government? Federal civilian? State and local?
Michael Bergen: There are a few different use cases across many different levels and sectors of the government and military.
State and local governments can use our data for economic recovery and determining whether or not people are going back to work in a post-COVID world. And they can also use it for infrastructure planning.
If you understand where people are working, where they’re living, and where they’re congregating, you can better understand where services and infrastructure are needed. If you can identify where people are moving to, you can more proactively plan for what may be needed in the future. This can be used to help plan for water infrastructure, mass transit, public parks – proactively identifying where more resources are needed, or may be needed in the future.
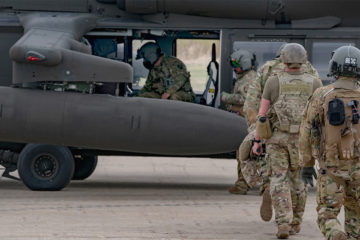
Alternatively, for the DoD and intelligence community, we can monitor what we call international macroeconomic indicators. We can identify key areas of interest around ports, or defense and industrial sites to determine patterns of activity. This can be used for virtual battle prep in the battlespace.
For law enforcement, because of our U.S. coverage, law enforcement can effectively use this data to effectively monitor key areas of interest, such as identifying stash houses for human trafficking and drug trafficking. We can help law enforcement understand if known stash houses are being used. We can also help them identify key points of interest around those stash houses to help establish and identify networks.
TLM: Why is data – like the data available from SafeGraph – important in emergency and disaster response scenarios? Why should those directing and organizing emergency and disaster response add data to their toolbox?
Michael Bergen: Some of the data that we provide has actually been used in the past to help people that are lost.
It’s a very powerful addition to other sources of data used in emergency and disaster response activities – such as drone data and satellite imagery. From a search and rescue standpoint, our data is the missing ingredient that makes their other data more useable. It helps agents understand where things are happening, and when they’re happening.
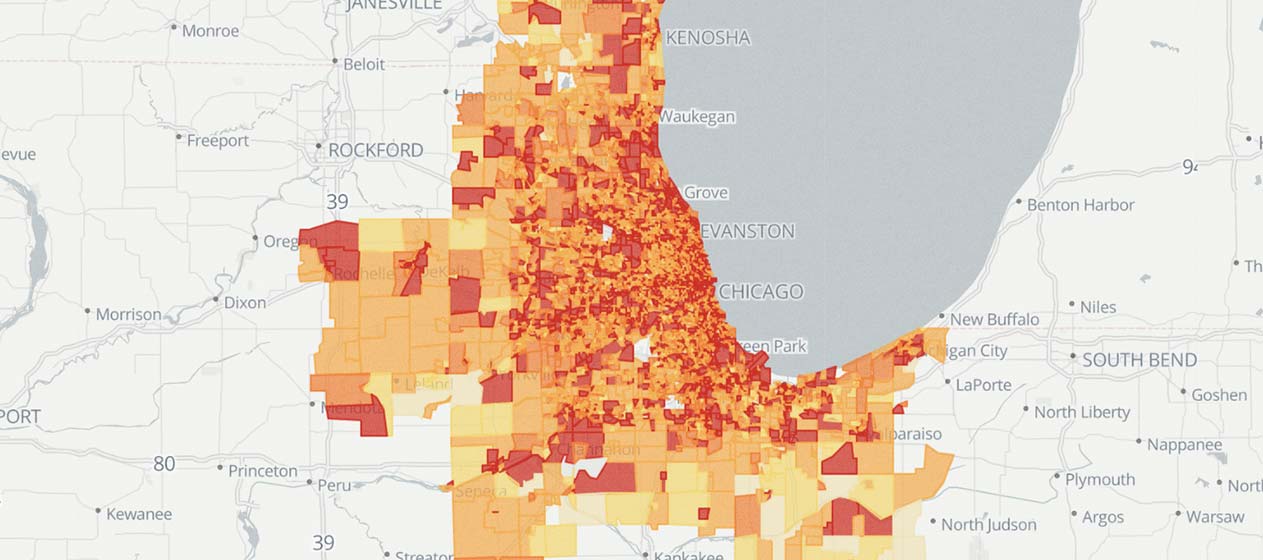
An incredible example of this is something that we’ve been doing with FEMA. For FEMA, we looked at grocery stores – which are fantastic places to organize a disaster response. Most grocery stores have generators. They already have food. And they have large parking lots that can be used as staging areas.

FEMA asked us to map out all of the grocery stores in the country and determine how many people could either walk or drive to it within ten minutes. We created a map that shows every grocery store in the United States and that is updated in real time. The map also illustrates the amount of the population that could either walk or drive to that grocery store in ten minutes.
Should there be a massive storm, or a major blackout, or an earthquake, FEMA can easily identify grocery store deserts where people won’t have access to disaster response or FEMA response should they set up their operations at grocery stores.
TLM: How does the integration of SafeGraph’s data and goTenna’s mobile mesh networking solutions make sense in an emergency and disaster response scenario? How could they integrate and work together to improve the situation?
Michael Bergen: There are two different ways that SafeGraph data can work in conjunction with mobile mesh networking solutions – like goTenna Pro X solutions – to make disaster response and other government operations more effective and efficient.
For example, using SafeGraph data, an organization like the Border Patrol could evaluate the southern border of the United States and identify high-traffic areas where they don’t have network connectivity or cell coverage. They could identify where those gaps are, and then help a mobile mesh networking solution provider – like goTenna – deploy their solutions in those high-traffic areas using a high altitude drone, or even an aerostat. This could help save lives by extending critical communications and situational awareness capabilities to agents in the field.
Our data can help identify where deploying these solutions would be most effective and deliver the most return on their investment. We can ensure that they’re deployed in areas where they need the most support.
Another use case for combining mobile mesh and SafeGraph data would be to get an intuitive, layered picture of an environment. Mobile mesh can help to connect remotely-deployed IoT devices – such as motion sensors and other network-enabled sensors. SafeGraph data can be layered with the data and alerts that those sensors generate to give tactical operators a richer, more robust operating picture. We can provide extra context so they have a real understanding of what is going on.


No Comment